 This really unique visualization represents the UK's interdependence. "Cartographers have long used flow maps to show the movement of objects from one location to another, such as the number of people in a migration, the amount of goods being traded, or the number of packets in a network. The advantage of flow maps is that they reduce visual clutter by merging edges."
Friday, August 8, 2008
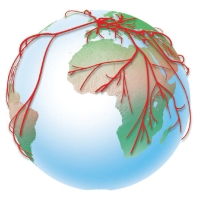
Flow map
This really unique visualization represents the UK's interdependence. "Cartographers have long used flow maps to show the movement of objects from one location to another, such as the number of people in a migration, the amount of goods being traded, or the number of packets in a network. The advantage of flow maps is that they reduce visual clutter by merging edges."
Subscribe to:
Post Comments (Atom)
No comments:
Post a Comment